
On this page
- What it is
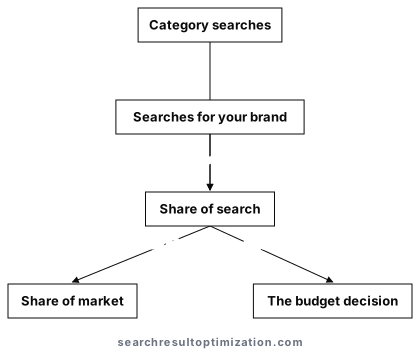
- Share of search is a brand's portion of the searches made in its category, used as an early reading of market demand.
- The problem until now
- Budgets were argued with share of voice, which counts spending, so the counter-evidence a market leaves in its own searches stayed outside the plan.
- What you can do from here
- You can calculate the figure for your category, tell a real shift from a spike with nothing behind it, and say what the number can carry and what it cannot.
Contents13
Tests on this page you have run: 0 of 3. The count stays in this browser only.
Jump to a test3
A market leaves a record of what it wants, every day, in its own words. Share of search is the attempt to read that record as a number.
Marketing has measured presence by spending for fifty years. Share of search measures it by demand instead, and the figure tends to move before sales do. This page states what the measure is, how it is calculated, what it predicts, and the three ways it misleads.
Every heading is a question. The answer stands directly under it, in plain words.
What is share of search?
Share of search is the portion of all searches in a category that name one brand. If a category produces 100,000 brand-name searches a month and 20,000 of them name you, your share of search is 20 per cent. It is a measure of demand expressed by people, rather than of presence bought by a budget.
Try it now
- Open Google Trends, enter your brand and your three largest competitors in one chart.
- Set the market to your country and the period to five years.
- Then, close the window. Think and search: whose line has been rising, and did anyone notice at the time?
Your category's demand curve, as the people in it produced it.
How is share of search calculated?
Take the brand names competing in the category, collect the search interest for each over the same period and the same market, add them to a total, and divide your own by that total. Google Trends gives relative interest rather than absolute counts, which is enough for a share, and the series is only comparable within one chart. The period matters more than the day: most people work with a twelve-week or thirteen-week moving average.
| Who | What to do | Free means | What it shows |
|---|---|---|---|
| Marketing lead | Build the series for your category once and keep it updated weekly | Google Trends, a spreadsheet | Your position in category demand |
| SEO | Separate brand searches from generic searches in reporting | Search Console, a regex filter on your brand name | Two numbers that mean different things |
| Your site | Check your own domain; replace example.com with it | site:example.com intitle:"brand" OR intitle:"vs" | Pages that answer brand-name searches |
How does share of voice differ from share of search?
Share of voice counts money in the market. Share of search counts attention in the market. The first is an input you control, the second is an outcome you observe, and the second is the harder one to buy.
“Share of voice measures the percentage of media spending by a company compared to the total media expenditure”
Reference: Wikipedia, Share of voice. https://en.wikipedia.org/wiki/Share_of_voice
What is excess share of voice?
Excess share of voice is a brand's share of voice minus its share of market. Advertising more than your size predicts growth, advertising less predicts decline, and the effectiveness studies of Les Binet and Peter Field put the rule of thumb at roughly ten points of excess share of voice for about half a point of market share growth in a year. The figure is a planning heuristic and it varies by category.
“Many factors besides SOV contribute to increased market share”
Reference: Nielsen, Budgeting for the Upturn: Does Share of Voice Matter, 2009. https://www.nielsen.com/insights/2009/budgeting-for-the-upturn-does-share-of-voice-matter/
Why is share of search treated as a leading indicator?
Because people look before they buy, and the looking shows up in query volume weeks or months before the purchase shows up in sales. The general mechanism is well documented outside marketing too: search query volume has been used to estimate the present state of things that official statistics report later, from unemployment claims to influenza rates.
| Who benefits | In everyday use | How it pays off |
|---|---|---|
| Management | Reads demand before it reaches the sales report | Decisions taken weeks earlier |
| SEO | Reports brand demand next to rankings | Search work argued in the language of the budget |
| Readers | See which brands a category actually asks for | Orientation before a purchase |
“the original model significantly mispredicted influenza-like illness rates in the US during the 2012”
Study: Lampos, Miller, Crossan and Stefansen, Scientific Reports 5, 12760, 2015. https://www.nature.com/articles/srep12760
Where does the data come from, and what are its limits?
From Google Trends in most cases, sometimes from a paid tool that models absolute volumes. Trends reports a normalised index rather than counts, it samples, it rounds small values to zero, and it covers one search engine. A figure built on it is a ratio between brands measured the same way, and it holds as long as every brand in the set is measured in the same chart, market and period.
Which searches count as brand searches?
The ones that name the brand: the name alone, the name with a product, the name misspelled, the name with a complaint attached. Generic category searches belong in a separate series, because they measure the size of the category rather than any brand's place in it. Mixing the two produces a number that rises when the category grows and says nothing about you.
What inflates the number with nothing behind it?
A crisis. A recall, a lawsuit, a viral complaint or a public dispute sends brand searches up sharply, and a share of search calculated that week reads like growth. The searches are real, the interest is real, and the intent behind them is the opposite of demand. Any spike wants a look at what people searched alongside the name before it is reported as a result.
| Who | What to do | Free means | What it shows |
|---|---|---|---|
| Marketing lead | Look at what was searched next to your name during a spike | Google Trends related queries | Whether the rise carried intent to buy |
| SEO | Annotate the series with known events | Your spreadsheet, a note per month | A chart that explains itself |
| Your site | Check your own domain; replace example.com with it | site:example.com intitle:recall OR intitle:complaint | What you publish for a bad week |
Try it now
- Find the sharpest upward spike in that chart.
- Search the brand name together with the month of the spike.
- Then, close the window. Think and search: was that growth, or was it a bad week made visible?
Whether a rise in searches was demand or damage.
What does mental availability have to do with it?
Mental availability is the likelihood that a brand comes to mind in a buying situation, and a search is one of the few moments where that coming-to-mind becomes visible. A brand that is searched by name in its category has been recalled, unprompted, by a person with a reason. That is what makes the measure interesting, and it is also why a pure volume reading misses the point: the question is which situations bring the name to mind, not how often the name appears.
What happens to the measure when answers replace visits?
The measure counts queries, and queries are still made, so the series continues. What changes is what a query leads to and where it is typed. Questions that once produced ten visits now produce one answer and no visit, and a growing part of the asking happens inside assistants that report nothing to the public tools. Share of search will keep producing a number while the behaviour underneath it moves, which is an argument for reading it next to something that counts people rather than queries.
Try it now
- Take one question your customers ask before buying and put it to an answer engine.
- Count how many brands are named in the answer, and whether yours is among them.
- Then, close the window. Think and search: how would that conversation appear in your search data?
The part of category demand that your tools no longer see.
What does the measure leave out?
The difference between a brand's pull and its size. Share of voice has a companion figure for that, excess share of voice, and share of search has none in common use. The same subtraction is available, share of search minus share of market, and a brand whose searches run ahead of its sales is in a different position from one whose searches trail them. Nothing is stopping a marketing team from calculating it.
What should a marketing manager do with the figure?
Track it weekly against the same competitor set, report it as a trend rather than a level, put it beside share of voice to see whether spending and attention are moving together, and treat every sharp move as a question rather than an answer. Used that way it is an early warning system that costs nothing but the time to build the series.
| Who benefits | In everyday use | How it pays off |
|---|---|---|
| Management | Tracks one number against a fixed competitor set | An early warning system that costs nothing |
| SEO | Connects search data to the market share conversation | A seat in the budget meeting |
| Readers | Get answers from a brand that watches its own category | Fewer surprises |
Last revised 2026-09-16.